First April Post
- Apr 3, 2018
- 2 min read
Today, I continued learning about chatbot. I followed a tutorial (https://blog.paperspace.com/intro-to-datascience/) to learn how to classify data, more specifically I learned how to code in a way so it will determine if a post is a spam or ham using R. This is similar to what I did last time, determining emotions by classifying words, but today's purpose was a more general idea: whether an email/question is important to the receiver. This is important to a company because the company usually gets a lot of emails that are not necessarily important to their business. These companies have already integrated the algorithm into their email so that junk emails are automatically moved to the junk box. The problem here is that the algorithm are not always right when determining if an email is a spam or not because it cannot fully understand the context; however, we can still train them using a dataset, and it can predict based on the dataset it learned.

This is how the coding starts. First, I loaded two packages, quanteda and RColorBrewer. Quanteda is a popular package for the statistical analysis of textual data, and RColorBrewer provides a suite of coloring options for the graphics we'll produce. In line 6, I made a variable "raw.data" which contains a dataset I was given. The dataset is on Excel like below, and I imported this dataset into R.

This dataset has already classified whether a message is ham or spam, so this will be used to train the model.

In line 8, I made it to create a table, on the left, to check the numbers of ham and spam messages.
The lines 10 and 11 would help to ensure that we are dealing with a random draw from our data just in case the data are not stored in a random distribution.
In natural language processing, it is more favorable to deal with corpus objects, which is like a master copy of our dataset from which we can pull subsets or observations as needed.

Now, we can construct word clouds and have a look at the differences in language they use. The larger the word displays, the more frequent that word appears in our data.

It is interesting to see many words like "free", "urgent", and "customer", and these words might intuitively come to mind when thinking about spam messages.
Same for ham messages, we can do:

and get:

Now, we get into the most important part where we predict outcomes.
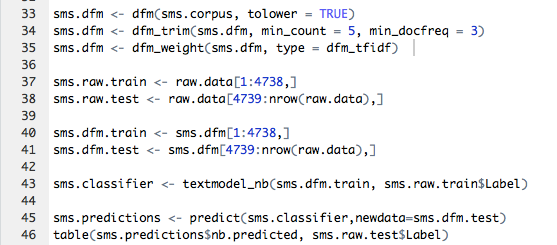
Lines 33 through 35 are to represent the text messages as word counts in the form of a DFM. For line 37, when I made a variable "sms.raw.train," I used 4738 because 85% of the dataset should be used to train the model, meaning the first through 4738th data is the 85% of the total number of messages. The remaining 15% of the data is used to see how well it can predict the spam or ham labels.
The result was:

This table should be read from left to right: the model classified 691 ham messages correctly as ham, and 7 ham messages incorrectly as spam. The model incorrectly classified 19 spam messages as ham, but 117 spam messages correctly as spam. As a result, this model classified spam and ham messages 98% correctly, which is pretty good!
Comments